
Note
Go to the end to download the full example code.
Sync map zoom#
Example showing how to synchromnize the zoom level (axes limits) of several
FITS map files using sync_zoom().
from madcubapy.io import MadcubaMap
from madcubapy.visualization import add_wcs_axes
from madcubapy.visualization import sync_zoom
import matplotlib.pyplot as plt
# Read fits file
map_high_res = MadcubaMap.read("../data/IRAS16293_SO2a_tm1.fits")
map_low_res = MadcubaMap.read("../data/IRAS16293_SO2a_tm2.fits")
# Create empty figure
fig = plt.figure(figsize=(10,5))
# Add as many WCS axes objects as desired.
# We can pass kwargs for matplotlib.pyploy.imshow()
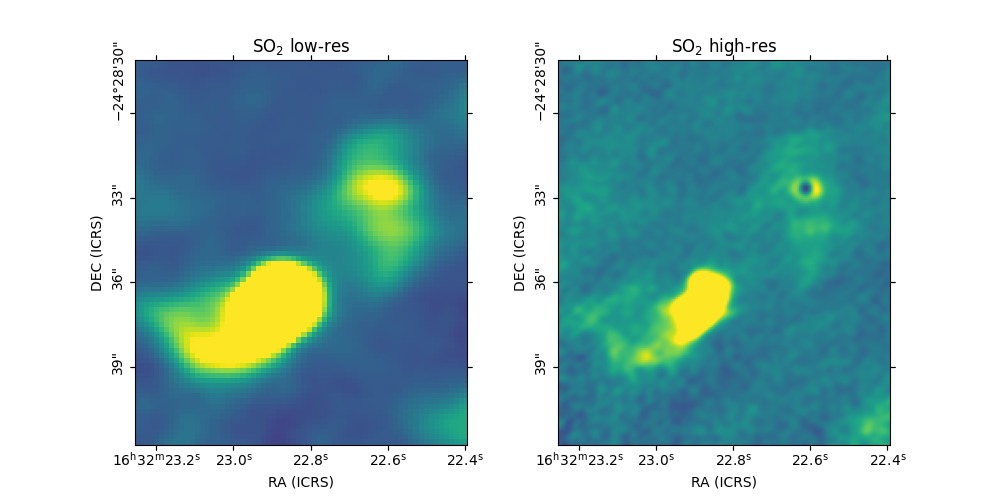
ax1, img1 = add_wcs_axes(fig, 1, 2, 1, fitsmap=map_low_res, vmax=1500)
ax1.set_title(r"SO$_2$ low-res")
ax2, img2 = add_wcs_axes(fig, 1, 2, 2, fitsmap=map_high_res, vmax=400)
ax2.set_title(r"SO$_2$ high-res")
# Activate synchronization between axes
sync_zoom(ax1, ax2)
# Any change in the limits of any of the synchronized axes after `sync_zoom`
# has been called will change the other axes as well.
ax2.set_xlim(140, 330)
ax2.set_ylim(130, 350)
plt.show()
Total running time of the script: (0 minutes 0.173 seconds)