
Note
Go to the end to download the full example code.
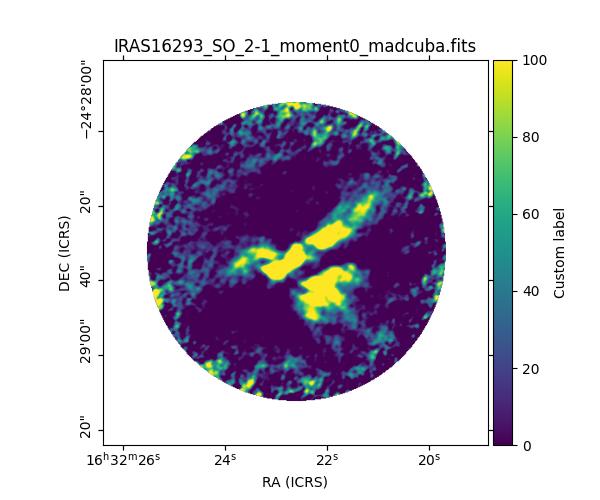
Add a colorbar to a map#
Example showing how to quickly add a colorbar to a map plot.
Even though adding a colorbar using matplotlib syntax directly is very
straightforward, madcubapy functions offer additional functionality and let
the user quickly add the colorbar using only one line of code.
We can add a colorbar by using
add_colorbar() or
insert_colorbar().
Both functions accept a number of additional parameters that are passed to
matplotlib.pyplot.colorbar(). With this we can set custom ticks, a custom
label, etc.
Check the Colorbar page to know more about how these two functions work.
from madcubapy.io import MadcubaMap
from madcubapy.visualization import insert_colorbar
from madcubapy.visualization import add_wcs_axes
import matplotlib.pyplot as plt

# Read fits file
madcuba_map = MadcubaMap.read("../data/IRAS16293_SO_2-1_moment0_madcuba.fits")

fig = plt.figure(figsize=(6,5))
ax, img = add_wcs_axes(fig, 1, 1, 1, fitsmap=madcuba_map, vmin=0, vmax=100)

# Add the colorbar. We can pass kwargs to matplotlib.Figure.colorbar()
insert_colorbar(ax, label='Custom label')

plt.show()
Total running time of the script: (0 minutes 0.110 seconds)