
Note
Go to the end to download the full example code.
Plot a map#
Example showing how to plot a fits map file with MadcubaMap
using add_wcs_axes().
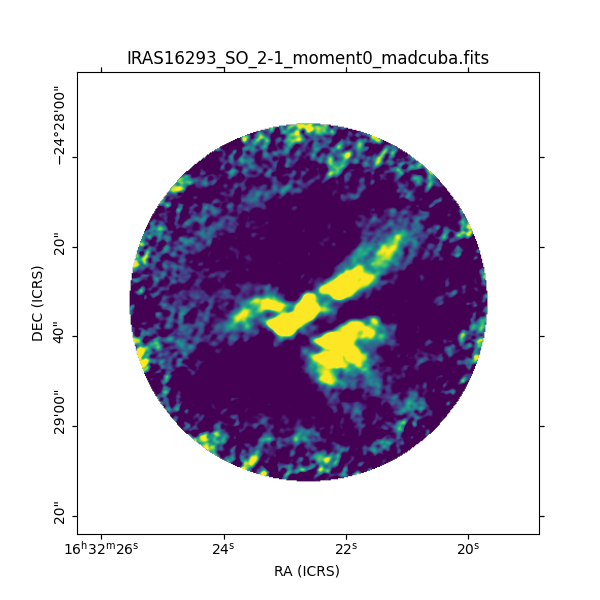
from madcubapy.io import MadcubaMap
from madcubapy.visualization import add_wcs_axes
import matplotlib.pyplot as plt

# Read fits file
madcuba_map = MadcubaMap.read("../data/IRAS16293_SO_2-1_moment0_madcuba.fits")

# Create empty figure
fig = plt.figure(figsize=(6,6))

# We can set kwargs that are passed to matplotlib.pyplot.imshow()
ax, img = add_wcs_axes(fig, fitsmap=madcuba_map, vmin=0, vmax=100)

plt.show()
Total running time of the script: (0 minutes 0.282 seconds)