
Note
Go to the end to download the full example code.
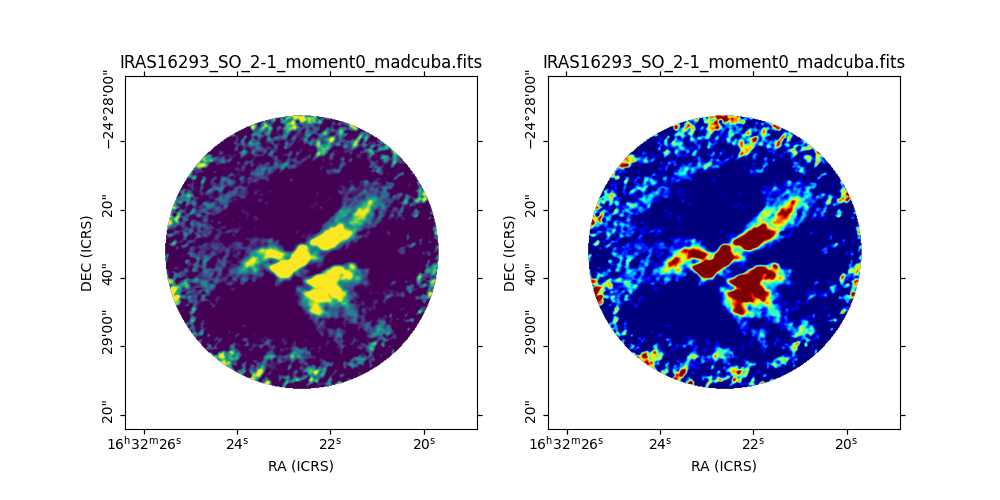
Plot several maps#
Example showing how to plot several fits map files with MadcubaMap using
add_wcs_axes().
We can add as
many subplots as needed following the same convention used for matplotlib’s
add_subplot(): nrows, ncols, number right
after the Figure that we want to use.
from madcubapy.io import MadcubaMap
from madcubapy.visualization import add_wcs_axes
import matplotlib.pyplot as plt

# Read fits file
madcuba_map = MadcubaMap.read("../data/IRAS16293_SO_2-1_moment0_madcuba.fits")

# Create empty figure
fig = plt.figure(figsize=(10,5))

# Add as many WCS axes objects as desired.
# We can pass kwargs for matplotlib.pyploy.imshow()
ax1, img1 = add_wcs_axes(fig, 1, 2, 1, fitsmap=madcuba_map, vmin=0, vmax=100)
ax2, img2 = add_wcs_axes(fig, 1, 2, 2, fitsmap=madcuba_map, vmin=0, vmax=100,
                         cmap='jet')

plt.show()
Total running time of the script: (0 minutes 0.147 seconds)